
Introduction
Mathematics is a fundamental discipline that cultivates students’ problem-solving abilities, logical reasoning, and analytical thinking (Agbata et al., 2024). Globally, strong mathematics performance is linked to better access to higher education and careers in science, technology, engineering, and mathematics (STEM) fields, which are essential for socio-economic development (Lafuente-Lechuga et al., 2020). However, achievement in mathematics remains uneven across and within education systems, with students often demonstrating inconsistent understanding across different mathematical domains (Organisation for Economic Co-operation and Development [OECD], 2019; Trends in International Mathematics and Science Study [TIMSS], 2019). In Rwanda, mathematics is a core subject under the Competence-Based Curriculum (CBC), which emphasizes the development of practical problem-solving skills and conceptual understanding. Despite these reforms, student performance in mathematics at the lower secondary level remains inconsistent, particularly in public day schools (Rwanda National Examination and School Authority [NESA], 2024). National data show marked variation in achievement, with some students progressing while others continue to struggle, especially in under-resourced schools. Prior studies attribute these disparities to factors such as teacher quality, instructional resources, and students’ mathematical attitudes (Nkundabakura et al., 2023).
This study focuses on five key mathematics topics: Algebra, Metric Measurement, Proportional Reasoning, Geometry, and Statistics & Probability which are consistently taught throughout the Rwandan lower secondary curriculum from S1 to S3. Although performance data at national, district, and school levels are typically reported in aggregate, without breakdowns by topic, this study adopts a topic-based analysis to generate deeper insights into students’ specific areas of understanding and difficulty. These domains are not only essential for higher-level mathematics but are also recognized internationally as areas of persistent challenge (Battista, 2007; Garfield & Ben-Zvi, 2007;Kilpatrick et al., 2001; Lamon, 2007). International assessments like the Programme for International Student Assessment (PISA) and TIMSS similarly report topic-specific disparities, especially in developing and transitioning education systems (OECD, 2019; TIMSS, 2019). Yet, most studies in sub-Saharan Africa, including Rwanda,report mathematics performance in aggregate form, without exploring which specific content areas students struggle with or excel in. A growing body of literature calls fordisaggregated performance analysisto support evidence -based curriculum development, differentiated instruction, and targeted interventions (Boaler, 2016; Mizoguchi, 2023). This gap is particularly pressing in low-income and post-conflict countries, where systemic inequities often undermine educational outcomes. By conducting a topic-level performance analysis among lower secondary students in Rwanda, this study contributes novel empirical evidence to the global discourse on mathematics learning progression and instructional quality.
Theoretically, the study is grounded in two theories: Piaget’s Theory of Cognitive Development (1952), which underscores how students’ progress through stages of understanding abstract concepts like algebra and proportionality and Vygotsky’s Sociocultural Theory (1978) which highlights the importance of scaffolding and guided interaction in learning mathematics. These perspectives provide valuable insight into how students’ development and classroom experiences interact to shape performance across different content areas. Empirically, prior research shows that each domain presents unique challenges. Algebra’s abstract nature and symbolic language often hinder comprehension (Kilpatrick et al., 2001). Proportional reasoning is conceptually demanding, especially for students lacking a strong foundation in fractions and ratios (Lamon, 2007). Geometry requires spatial visualization, while Statistics and Probability demand real-world data interpretation and probabilistic thinking (Garfield & Ben-Zvi, 2007). Measurement, including units and tools, is critical for everyday applications but is often underemphasized in teaching (Stephan & Clements, 2003).
Although topic-specific studies have emerged in Japan (Mizoguchi, 2023), the United States (Boaler, 2016), and other OECD countries, such efforts remain rare in sub-Saharan Africa. This study addresses this gap by analyzing students’ performance across the five selected topics in Rwanda’s lower secondary schools, offering comparative insights that can inform teaching strategies both locally and globally.
Methodology
Research Design
This study adopted a quantitative descriptive research design to investigate students’ academic performance in mathematics across specific topic areas. This approach is appropriate for identifying patterns and differences in academic achievement based on numerical data. The study relied on documented student assessment records and teacher responses to structured questionnaires, allowing for an objective and topic-specific analysis of performance. The design supports the development of evidence-based insights into students’ mathematical competencies and highlights areas in need of targeted instructional support.
Sample and Data Collection
This study examined mathematics performance in lower secondary schools in Rwanda, focusing on topic-specific achievement. Three public day schools were purposively selected to reflect diverse geographical and educational contexts: GS Rushara (rural, Burera District), GS Sheli (semi-urban, Kamonyi District), and GS Nyarugugu (urban, Kicukiro District). Public day schools were chosen due to their consistent underperformance in national exams, making themcentral to understanding challenges in mathematics learning. Participants included Senior One (S1) and Senior Two (S2) students,typically aged 13–16, with a gender balance of 53% female and 47% male. Studentsfrom the selected schools came from communities where most families rely on farming, informal trade, or public service for their livelihoods. Data collection occurred from October 2024 to January 2025, following ethical approval fromthemayors of Burera district,Kamonyi district,and Kigali city,and school permissions. Examination scripts for the third term of the 2022–2023 (S1) and 2023–2024 (S2) academic years served as the primary data source. From the 585 scripts collected, only 267 students had complete data from both years, forming matched pairs of results for the final analysis. Scripts were categorized and analyzed across five mathematics topics: Algebra, Metric Measurement, Proportional Reasoning, Geometry, and Statistics and Probability. Additionally, Structured questionnaires were administered to eight mathematics teachers (5 females, 3 male) with 5–20 years of experience. They had taught the participating students from Senior 1 to Senior 2 and were selected for their direct experience with the five topic areas. Their feedback, gathered through a Likert-scale questionnaire, provided insights into students’ strengths and challenges, helping to contextualize the performance data. All responses were anonymized, and data collection ensured accuracy and confidentiality.
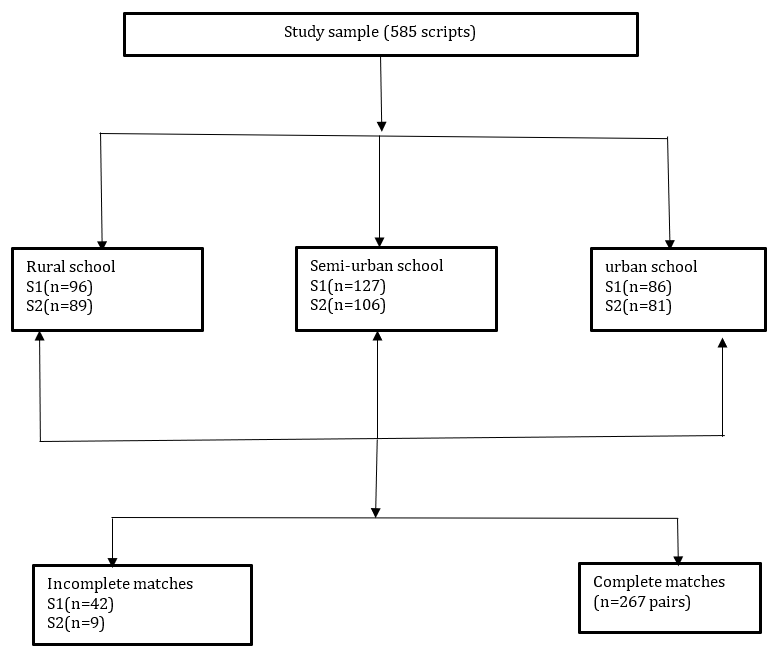
Figure 1.Sampleselection and matching
Data analysis
The collected data was analyzed using both descriptive and inferential statistical methods. Descriptive statistics, including means and standard deviations, were calculated to summarize student performance across the five designated mathematics topic areas. To compare performance variations between Senior 1 (S1) and Senior 2 (S2) students within each topic area, one-way Analysis of Variance (ANOVA) tests was conducted. Effect sizes (η²) was calculated to determine the magnitude of statistically significant differences. Additionally, descriptive statistics was used to summarize teachers’ questionnaire responses regarding student performance in the same topic areas. The findings are presented in tables and figures for clarity. All statistical analyses were performed using SPSS software to ensure accuracy and reliability.
Findings/Results
Student Mathematics Performance Across Topic Areas (students’ scripts)
The analysis of student mathematics performance across five topic areas: Algebra, Metric Measurement, Proportional Reasoning, Geometry, and Statistics & Probability revealed varying levels of achievement between Senior 1 (S1) and Senior 2 (S2) students.
Algebra Performance
This section compares S1 and S2 students' performance in Algebra using an ANOVA analysis to assess any statistically significant differences between the two groups,as shown in Table 1.
Table 1.Students’ Performance in Algebra
| ANOVA Table of Algebra Performance | |||||
| SS | DF | MS | F | Sig. | |
| Between Groups | 1104.672 | 1 | 1104.672 | 3.847 | .050 |
| Within Groups | 152750.720 | 532 | 287.125 | ||
| Total | 153855.392 | 533 |
Table 1 for Algebra performance, comparing S1 and S2 students, indicatesa borderline statistically significant difference, with ap-value of .050. This suggests that the variation in performance between the two groups is at the threshold of statistical significance, meaning the difference is noticeable but not strongly pronounced. The F-statistic of 3.847 reflects a relatively small disparity in students' scores between S1 and S2. To further interpret the findings, the effect size (η²) was calculated as 0.007, meaning that only 0.7% of the total variance in Algebra performance can be attributed to the difference between S1 and S2 students. This represents a very small effect, indicating that although S2 students may perform slightly better in Algebra than S1 students, the improvement is minimal and not substantial. Additionally, thesignificantwithin-group variance, as shown by the within-groups sum of squares (152,750.720) and mean square (287.125), suggests that performance differences among students within the same grade level are much greater than the differences between the two groups. Overall, while the findings suggest a slight advantage for S2 students, the small effect size and high within-group variability indicate that progression in Algebra understanding is not strongly influenced by grade level alone.
Metric Measurement Performance
To assess whether there were significant differences in Metric Measurement performance between Senior One (S1) and Senior Two (S2) students, an Analysis of Variance (ANOVA) was conducted. The results are presented in the following table.
Table 2.Students’ Performance in Metric Measurements
| ANOVA Table of Metric Measurements performance | |||||
| SS | DF | MS | F | Sig. | |
| Between Groups | 704.445 | 1 | 704.445 | 1.418 | .234 |
| Within Groups | 264273.806 | 532 | 496.755 | ||
| Total | 264978.252 | 533 |
The ANOVA results for Metric Measurement (Table 2) show no statistically significant difference between the performance of S1 and S2 students, as indicated by the p-value of 0.234. This suggests that the performance variation between the two groups was minor and not strong enough to be considered meaningful(Ngwokabuenui, 2015). Additionally, the F-statistic of 1.418 supports this conclusion, indicating that the scores between S1 and S2 students differ only slightly. The calculated effect size (η²) was 0.003, which means only 0.3% of the total variance in Metric Measurement performance can be attributed to the difference between S1 and S2 students. This small effect size implies that the overall performance between the two groups is quite similar, further reinforcing the lack of substantial progress between the grade levels(Stern & Piper, n.d.). Furthermore, the large within-group variance, as evidenced by the within-group sum of squares (264,273.806) and mean square (496.755), indicates that differences in performance are more pronounced within each group than between S1 and S2 students. This suggests that other factors, such as individual learning abilities, prior knowledge, instructional methods, and the learning environment, could contribute more significantly to the variation in performance than simply the grade level progression(Felder, 2017). These findings align with research that suggests grade progression alone does not necessarily lead to substantial improvement in certain topic areas unless accompanied by other factors such as targeted instructional strategies and learner engagement(Qureshi et al., 2021).
Proportional Reasoning Performance
Proportional Reasoning, involving the understanding of ratios, fractions, and scaling, is foundational for mathematical problem-solving(Sari et al., 2023). To determine if significant performance differences exist between Senior 1 (S1) and Senior 2 (S2) students, an ANOVA was conducted. The results are presented in Table 3.
Table 3.Students’ Performance in Proportional Reasoning
| ANOVA Table of Proportional Reasoning performance | |||||
| SS | DF | MS | F | Sig. | |
| Between Groups | 28147.267 | 1 | 28147.267 | 32.027 | .000 |
| Within Groups | 467553.677 | 532 | 878.860 | ||
| Total | 495700.944 | 533 |
The ANOVA results for Proportional Reasoning performance (Table 3) show a statistically significant difference between S1 and S2 students, as indicated by the p-value of 0.000. This suggests that the variation in performance between the two groups is meaningful. The F-statistic of 32.027 further emphasizes that the difference in performance is pronounced, supporting the conclusion that S2 students perform significantly better than their S1 counterparts. The effect size (η²) was calculated to be 0.057, indicating that 5.7% of the total variance in Proportional Reasoning scores is associated with differences between S1 and S2 students. This suggests a moderate effect, which indicates that while S2 students tend to perform better, the gap is not exceptionally large(Plonsky, 2018)Despite the significant difference between groups, the substantial within-group variance, reflected in the within-group sum of squares (467,553.677) and mean square (878.860), highlights that differences within each grade level are still notable. This suggests that other factors, such as individual learning abilities, teaching methods, or classroom environment, contribute significantly to variations in performance, even within the same grade level(Munna & Kalam, 2021).
Geometry Performance
Geometry plays a critical role in developing spatial reasoning and problem-solving skills, essential components of mathematical proficiency (Oktaviana et al., 2025). To assess performance differences between Senior 1 (S1) and Senior 2 (S2) students, an Analysis of Variance (ANOVA) was conducted. The results, examining significant differences and variations in their scores, are presented inTable 4.
Table4.Students’ Performance in Geometry
| ANOVA Table of Geometry performance | |||||
| SS | DF | MS | F | Sig. | |
| Between Groups | 22527.646 | 1 | 22527.646 | 115.060 | .000 |
| Within Groups | 104160.480 | 532 | 195.790 | ||
| Total | 126688.126 | 533 |
The ANOVA results for Geometry performance (Table 4) reveal a statistically significant difference between S1 and S2 students, with a p-value of 0.000. This indicates that the differences in performance between the two groupsarenot due to chance, suggesting a meaningful disparity in their scores. The F-statistic of 115.060 further corroborates the substantial difference in performance between the two groups, reflecting a strong effect. The effect size (η²) was calculated at 0.178, indicating that 17.8% of the total variance in Geometry scores is attributed to the difference between S1 and S2 students. This represents a large effect, implying that the performance gap between the two groups is considerable, with S2 students generally outperforming S1 students. This finding is consistent with previous research, which found that progression through educational levels often results in better academic performance(Ozcan, 2021). Additionally, the within-group variance, as indicated by the within-groups sum of squares (104,160.480) and mean square (195.790), highlights that while there are differences within each group, they are relatively smaller compared to the overall disparity between S1 and S2 students. This suggests that the performance of S2 students is more consistent, with fewer variations among them than S1 students.
Statistics and Probability Performance
Statistics and Probability are essential for developing skills in data interpretation, analysis, and informed decision-making (Su et al., 2024). To investigate potential differences in performance between Senior 1 (S1) and Senior 2 (S2) students, an Analysis of Variance (ANOVA) was conducted. The results of this analysis, which examined significant differences in their scores, are presented in Table 5.
Table 5.Students’ Performance in Statistics and Probability
| ANOVA Table of Statistics &Probability performance | |||||
| SS | DF | MS | F | Sig. | |
| Between Groups | 151175.452 | 1 | 151175.452 | 220.467 | .000 |
| Within Groups | 364795.925 | 532 | 685.707 | ||
| Total | 515971.377 | 533 |
The ANOVA results for statistics and probability performance (Table 5) show a statistically significant difference between S1 and S2 students, with a p-value of 0.000. This indicates that the performance disparity between the two groups is not due to random chance, confirming a meaningful difference in their scores(Kwak, 2023). The F-statistic of 220.467 further supports this, signifying a very strong difference in performance levels between the two groups. The effect size (η²) was calculated as 0.293, meaning that 29.3% of the total variance in statistics and probability scores can be explained by the differences between S1 and S2 students. This is considered a large effect, highlighting that the gap in performance is substantial. Specifically, S2 students tend to score much higher than their S1 counterparts, indicating that grade progression results in significant improvement in their grasp of statistics and probability. Additionally, the within-group variance, as shown by the within-groups sum of squares (364,795.925) and mean square (685.707), reveals that while there are some individual differences within each group, the overall distinction between the two groups is pronounced. This suggests that most S2 students have a noticeably stronger understanding of statistics and probability compared to their S1 peers. This aligns with previous studies that suggest academic progression is associated with enhanced mastery of subject content(Gallacher & Johnson, 2019).
G.S Rushara Performance Across Topic Areas (Rural Area- School)
G.S. Rushara, a school located in a rural area, presents a unique context for examining students’ mathematics performance. This section focuses on the comparative performance of Senior 1 (S1) and Senior 2 (S2) students at G.S. Rushara across the five designated mathematics topic areas. Figure 2, provides a detailed visual illustration of the performance rates, offering insights into the school’s specific trends.
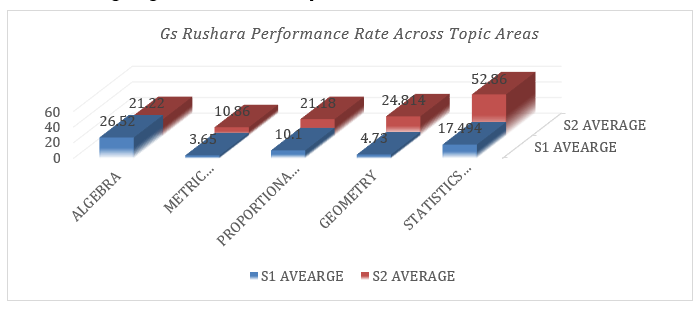
Figure 2.G.S.Rushara Performance Rate Across Topic Areas
The bar chart(Figure2) illustrates the performance of students at GS Rushara across five topic areas in mathematics, comparing averages from Senior 1 (S1) and Senior 2 (S2). The data highlights a significant improvement in Statistics and Probability, where the S2 average far surpasses that of S1. This suggests enhanced conceptual understanding and possibly the impact of improved instructional strategies in this topic(Ismail et al., 2022).Proportional ReasoningandGeometryalso show notable progress from S1 to S2, with consistent growth in averages. However,Algebraexhibits a smaller margin of improvement, indicating relatively stable performance across the two years.Metric Measurements, on the other hand, shows minimal improvement, suggesting that students may still struggle with this area. Overall, the results suggest a positive trajectory in student performance across most topics, particularly in areas like Statistics and Probability, which recorded the highest growth. However, the limited progress in Metric Measurements signals the need for focused intervention to help students grasptheseconcepts more effectively(Learners, 2020).
G.S.SHELI Performance Across Topic Areas (Semi-Rural Area)
G.S. Sheli, situated in a semi-rural area, provides a distinct setting for analyzing student mathematics achievement. This section presents a comparative analysis of Senior 1 (S1) and Senior 2 (S2) student performance across the five designated mathematics topic areas at G.S. Sheli. Figure 3 illustrates the performance rates, offering a clear visual representation of student achievement in each topic area.
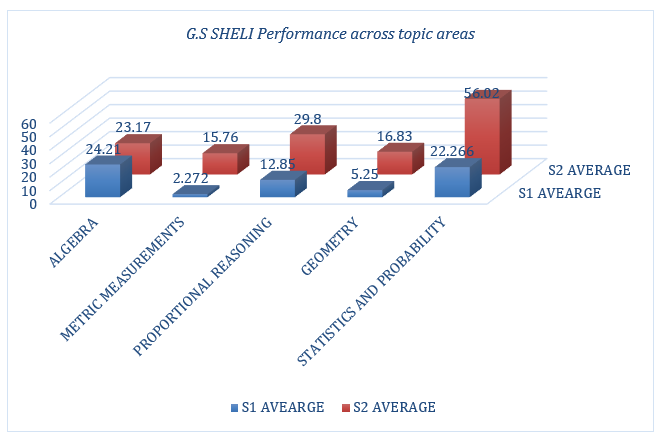
Figure 3.G.S.Sheli, Performance Rate Across Topic Areas
The bar chart (Figure 3) depicts the average performance of students at G.S.Sheli across five mathematics topic areas, comparing results from Senior 1 (S1) and Senior 2 (S2).
Statistics and Probabilitystands out with the most significant improvement, as the S2 average surpasses the S1 average by a wide margin, reflecting substantial progress in this topic area. Similarly,Proportional Reasoningshows notable growth, with students demonstrating a marked improvement in understanding and application.Geometryalso records positive progress, though the margin is smaller compared to the first two topics. In contrast,Algebrashows marginal improvement, indicating relatively consistent performance over the two years.Metric Measurements, however,revealminimal progress, suggesting that this area remains a challenge for many students. These findings underscore the importance of targeted teaching strategies, particularly in topics like Metric Measurements and Algebra, to help students achieve better outcomes. The strong improvement in Statistics and Probability and Proportional Reasoning highlights effective teaching practices or curriculum adjustments that could be modeled for other areas.
G.S.NyaruguguPerformance Across Topic Areas (Urban Area-School)
G.S. Nyarugugu, an urban school, offers a contrasting perspective on student mathematics achievement. This section presents the findings on the comparative performance of Senior 1 (S1) and Senior 2 (S2) students at G.S. Nyarugugu across the five designated mathematics topic areas. Figure 4 provides a detailed visual overview of student performance in each topic area, highlighting the school's specific trends.
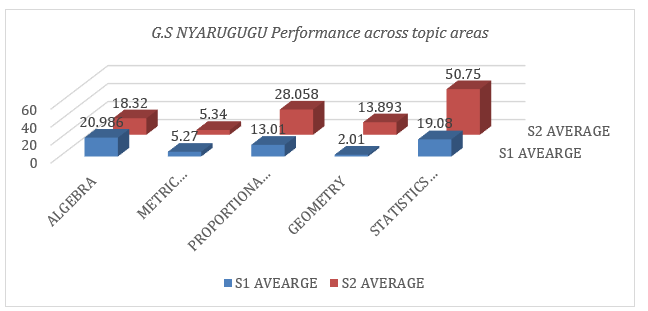
Figure 4.G.S.Nyarugugu, Performance Rate Across Topic Areas
The performance trends at G.S.Nyarugugu reveal significant variations across mathematics topic areas between Senior 1 (S1) and Senior 2 (S2). InAlgebra, there is a noticeable decline in student performance, suggesting difficulties in retaining or improving skills as students’ progress. Similarly,Metric Measurementsremaina consistently challenging area, with only marginal improvement between the two years.Conversely, there is a substantial improvement inProportional ReasoningandGeometry, indicating better comprehension and application of these concepts asstudentsadvance. This could be attributed to increased exposure to these topics or more effective teaching strategies in S2(Paper et al., 2017). The most remarkable progress is observed inStatistics and Probability, where students show significant growth in their understanding and performance. This improvement highlights a strong grasp of statistical concepts and might reflect better instructional techniques or more engagement with practical applications of the topic(Mazana et al., 2018).
General Performance of All Three Selected Schools
To provide a comprehensive view of student mathematics achievement, this section presents a summary of findings across the three selected schools. Figure 5, illustrates the overall comparative performance of Senior 1 (S1) and Senior 2 (S2) students across the five designated mathematics topic areas, offering a detailed visual overview of general trends and patterns.
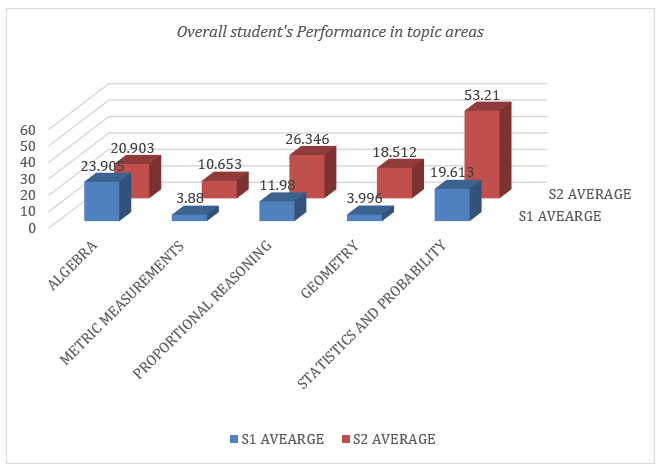
Figure 5.Overall Performance Rate of All Three Selected Schools Across Topic Areas
The bar chart provides a visual complement to the findings in the table, illustrating trends in students' performance across mathematics topic areas between Senior One (S1) and Senior Two (S2). In Algebra, the chart reveals a slight decline in performance from S1 to S2, reinforcing the table's observation of a minor reduction in this topic. For Metric Measurements, the significant improvement in S2 is clearly visible, with a notable difference in bar heights, reflecting better outcomes among S2 students. Proportional Reasoning shows a marginal decline from S1 to S2, as indicated by the slightly lower bar for S2, suggesting the need for targeted interventions in this area(Sari et al., 2023). Geometry, on the other hand, exhibits a sharp rise in S2 performance, indicating significant progress in student understanding. Lastly, the chart underscores Statistics and Probability as the most successful topic for S2, with a dramatic increase in performance compared to S1. These findings align with research, which also observed that students tend to struggle withproportional reasoning and metric measurements,while finding Statistics and Probability more accessible(Sari et al., 2023).
Teachers’ Perspectives on Students’ Performance Across Mathematics Topics
To gain a deeper understanding of student mathematics performance, this section presents a summary of teachers' perspectives across the five designated mathematics topic areas. Table 6 summarizes the teachers’ responses, offering valuable insights into students' perceived strengths and challenges in Algebra, Metric Measurement, Proportional Reasoning, Geometry, and statistics and probability.
Table 6.Teachers’ PerspectivesonStudents’ Performance Across Topic Areas
| No | Students' academic performance in mathematics across specific topic areas | Strongly Disagree | Disagree | Neutral | Agree | Strongly Agree |
| 1 | Students perform well algebraic concepts compared to other mathematics topics. | 1.25% | 12.5% | 12.5% | 37.5% | 25% |
| 2 | Students easily to apply metric measurements in practical situations. | 0% | 0% | 62.5% | 25% | 12.5% |
| 3 | Students easily use proportional reasoning to solve mathematical problems | 25% | 37.5% | 12.5% | 25% | 0% |
| 4 | Students find geometry easier to understand than other mathematics topics. | 0% | 37.5% | 25% | 25% | 12.5% |
| 5 | Students are confident in solving questions related to statistics and probability | 12.5% | 25% | 12.5% | 12.5% | 37.5% |
From table 6, Teachers’ responses indicate that algebra is generally perceived as a strength for students, with62.5% of respondents agreeing or strongly agreeingthat students perform well in algebraic concepts. These findings are consistent with previous research, which also highlights Algebra as a relatively strong area for students due to its structured and rule-based nature(Stephens et al., 2021).However,13.75% of teachers disagreed or strongly disagreed, indicating that some students still face challenges in mastering algebra. For metric measurements, the majority of teachers (62.5%) provided a neutral response regarding students’ ability to apply metric measurements in practical situations, while37.5% agreed or strongly agreedthat students demonstrate proficiency in this area. The high percentage of neutral responses aligns with findingsthatemphasize that effective teaching of metric measurements relies on hands-on, real-world applications to reinforce understanding(Thelma et al., 2024). This suggests that variability in students’ proficiency may stem from differences in instructional approaches and access to practical learning opportunities. Lack of strong agreement highlights the need for more experiential learning opportunities in this area. Proportional reasoning appears to be one of the most challenging areas for students, with62.5% of teachers disagreeing or strongly disagreeingthat students can easily apply proportional reasoning to solve mathematical problems. Only25% of teachers agreed, and12.5% remained neutral. This aligns with studies showing that proportional reasoning requires higher-order thinking skills and abstract reasoning, which many students struggle to develop without sufficient conceptual grounding(Ade et al., 2023). Given the importance of proportional reasoning in real-world problem-solving and advanced mathematics, additional instructional support and targeted interventions may be necessary. Teachers’ perspectives on students’ understanding of geometry were mixed.37.5% of respondents disagreedthat students find geometry easier to understand, while37.5% agreed or strongly agreed, and25% remained neutral. The distribution of responses suggests that while some students excel in geometry, others may struggle due to the abstract and spatial reasoning required. Research indicates that the use of interactive and visual teaching methods, such as dynamic geometry software, significantly enhances students’ comprehension of geometric concepts(Adelabu et al., 2019). The variation in responses may reflect differences in teaching methodologies and student engagement levels. Teachers’ responses regarding students’ confidence in solving statistics and probability questions were diverse. While50% of teachers agreed or strongly agreedthat students are confident in these topics,37.5% disagreed or strongly disagreed, and12.5% remained neutral. This suggests a divide in student competency, which may be attributed to variations in instructional methods and students' exposure to real-world statistical applications. Research highlights that integrating contextualized problems and data analysis activities into instruction improves student engagement and performance in statistics and probability(Li, 2022).
Discussion
This study analyzed students' academic performance in mathematics across specific topic areas in selected lower secondary schools in Rwanda. The findings revealed significant variations in performance, with notable progress in some topics while others showed minimal improvement. These results highlight key areas requiring targeted instructional interventions and align with existing literature on student learning in mathematics (Kilpatrick et al., 2001; NESA, 2023).
The analysis of Algebra performance indicated minimal improvement between S1 and S2 students, with a borderline statistically significant difference. This aligns with prior research suggesting that Algebra remains a challenging subject due to its abstract nature and the need for symbolic manipulation (Kilpatrick et al., 2001). The high within-group variance further suggests that factors beyond grade level, such as individual learning differences and teaching methodologies, may play a crucial role in student performance (Nkundabakuraet al., 2023). These findings emphasize the need for instructional approaches that enhance conceptual understanding rather than rote memorization.
Metric Measurement performance showed no significant improvement between S1 and S2 students, reinforcing findings from previous studies that students often struggle to apply measurement concepts effectively (Stern & Piper, n.d.). The lack of significant progress may be attributed to limited hands-on learning experiences, as suggested by the neutral responses from teachers regarding student proficiency in this area. This calls for more practical and experiential learning opportunities to enhance students’ understanding and application of metric concepts (Thelma et al., 2024).
Proportional Reasoning exhibited moderate improvement, with a statistically significant difference between S1 and S2 students. However, teachers’ perspectives indicated that students still face considerable difficulties in applying proportional reasoning to solve mathematical problems. This aligns with existing literature highlighting the complexity of proportional reasoning and the necessity for strong conceptual foundations (Lamon, 2007). The findings suggest that additional scaffolding and structured problem-solving activities may be required to strengthen students' proportional reasoning skills (Ade et al., 2023).
The results for Geometry showed a substantial improvement among S2 students, with a large effect size indicating significant progress. Previous studies suggest that exposure to visual and interactive learning methods enhances students’ spatial reasoning and understanding of geometric concepts (Battista, 2007). However, teachers' perspectives were mixed, suggesting that while students’ scores improved, some still struggle with geometric principles. Thisdiscrepancy highlights the importance of reinforcing conceptual learning through engaging and interactive instructional strategies (Adelabu et al., 2019).
Statistics and Probability demonstrated the strongest improvement among all the mathematics topics analyzed, with S2 students performing significantly better than their S1 counterparts. This aligns with prior research suggesting that students find statistics more accessible due to its real-world applications (Garfield & Ben-Zvi, 2007). Teachers’ perspectives also supported this finding, with many agreeing that students were confident in solving statistics-related problems. The researchers suggest that incorporating real-world data analysis and contextualized teaching strategies has positively influenced student learning outcomes in this area (Li, 2022).
These findings contribute to the broader discussion on mathematics education by confirming trends observed in previous research while also highlighting areas that require targeted intervention. The results indicate that while some topics benefit from natural progression, others demand intentional instructional strategies to enhance student comprehension. By integrating real-world applications, promoting conceptual understanding, and employing interactive teaching methods, educators can support student success in mathematics at the lower secondary level in Rwanda (United Nations Educational, Scientific and Cultural Organization[UNESCO], 2022; Mazana et al., 2018).
Conclusion
This study offers novel insights into students’ mathematics performance by disaggregating achievement across five specific topic areas: Algebra, Metric Measurement, Proportional Reasoning, Geometry, and Statistics and Probability in selected Rwandan lower secondary schools. Unlike most prior research that reports mathematics results in aggregate, this study reveals domain-specific trends, identifying areas of significant progress (e.g., Statistics and Probability, Geometry) as well as persistent challenges (e.g., Algebra, Metric Measurement). This level of topic-based analysis uncovers learning disparities that would otherwise remain obscured in general performance reports. The study contributes new empirical evidence to the field of mathematics by providing the comprehensive, topic-level analysis of student performance within the Rwandan lower secondary context. It addresses a critical research gap by demonstrating that national-level performance trends mask meaningful variation in student understanding across mathematical domains. Furthermore, the integration of teachers’ perspectives enriches the findings, revealing mismatches between observed student performance and teacher expectations. These findings advance international discourse on mathematics learning and support the development of more targeted, evidence-informed pedagogical strategies aimed at improving conceptual understanding in mathematics education.
Recommendations
Based on the findings, several practical recommendations can help to improve mathematics teaching and learning. First, schools are encouraged to adopt teaching methods that make abstract concepts easier to understand. For example, the Concrete-Pictorial-Abstract (CPA) approach allows students to move from hands-on materials to diagrams and then to symbols, which can be especially helpful in topics like Algebra and Metric Measurement. Teachers should be supported with training focused on these areas, especially where students have shown persistent difficulties. second, while schools cannot change the national curriculum, they can improve how it is delivered. Teachers should use more real-life examples and practical activities to help students relate mathematical concepts to everyday situations. This approach is especially helpful in topics like Statistics and Probability, where students performed better. Making other topics, such as Algebra and Proportional Reasoning, more relevant through real-life applications can boost understanding and student interest. Thirdly, the study found that some topics show much less improvement than others, even as students move from S1 to S2. This suggests that passing national exams may not always reflect true understanding. Teachers and school leaders should look beyond exam results and use regular topic-level assessments to better track learning.
Finally, future studies should include a broader range of schools, such as private, boarding, and under-resourced,to determine whether similar patterns of topic-specific performance emerge. It is also important to extend this research to include primary schools, as foundational mathematical understandingisdeveloped at earlier stages. Examining how teaching styles interact with topic-level achievement from primary through secondary education would offer a more comprehensive view of learning trajectories and inform targeted interventions across the entire basic education cycle.
Limitations
While this study offers valuable insights intothemathematics performance of lower secondary students in Rwanda, several limitations should be acknowledged. First, the research focused exclusively on public day schools, potentially limiting the generalizability of findings to other types of schools, such as private or boarding institutions. Second, the analysis relied on student performance data from a specific academic period, which may not reflect long-term trends or fully capture the dynamic nature of academic achievement over time. Furthermore, although the study examined key topic areas within the mathematics curriculum, it did not consider other potentially influential factors, such as students’ socio-economic backgrounds, parental involvement, or teachers’ professional experience. Lastly, the use of self-reported data from teachers regarding their instructional practices may introduce bias, as respondents might have reported idealized rather than actual behaviors. These limitations highlight the need for further research incorporating a broaderrange of school types, extended data collection periods, and a more comprehensive set of variables to deepen the understanding of mathematics performance in the Rwandan context.
Ethics Statements
This study received ethical clearance from the Director of Research and Innovation, University of Rwanda – College of Education (UR-CE). Following this approval, formal authorization letters were obtained from the mayors of Kigali City, Burera District, and Kamonyi District to facilitate data collection. Subsequently, school head teachers granted permission to access student academic records and to engage teachers in the study. Written informed consent was obtained from all participating teachers. All student data were anonymized prior to analysis, and the research procedures complied with ethical standards for studies involving human participants.
Generative AI Statement
Generative AI tools such as Grammarly were used to support proofreading, grammar correction, and clarity improvements. All final revisions were reviewed and approved by the authors to ensure accuracy and integrity.
Authorship Contribution Statement
Masengesho: Developed conceptualization, literature review, methodology development, data collection, analysis, interpretation, and manuscript writing. Sindayigaya: Contributed to the conceptualization, provided methodological guidance, supervised data analysis and interpretation, and critically reviewed the manuscript.