
Introduction
As early as 1958, Prescott suggested that cognitive development was the primary factor in learning success. It may be suggested that countless factors truly have an influence on learning efficiency, but thosethatload the highest can be grouped into cognitive and non-cognitive factors, as has been alluded to by several researchers (Duckworth et al., 2019; Messick, 1979). In any event, as Binet and Simon (1916) referred to them over 100 years ago, non-intellectual factors, in this case,mathematical affect and identity, play a considerable role in student achievement and success.
In this paper,middle-gradestudents’ mathematics affect (operationally defined as students’ feelings, emotions, dispositions, and attitudes) and their mathematics identity (operationally defined as how students perceive themselves) are discussed using a mixture of quantitative and qualitative data. A slowly increasing corpus of literature exists to substantiate the importance of affect stabilization in middle grades (e.g., Birgin et al., 2017; Collie et al., 2019; Ruiz, 2020). However, little empirical work has been invested in the construct of mathematical affect in middle grades and when it stabilizes, since Hart and Walker’s initial hypothesis that it does stabilize just after grade 6 (1993). Generally speaking, the trend is for mathematical affect ratings to decrease in grades four to six and then to stabilize around grade 7. In this study, similar results were found in middle grades. Further, issues relevant to student affect and identity are discussed, with an emphasis on whenthey startto stabilize in mathematics settings.
Mathematical identity and mathematical affect are considered factors (Cai & Leikin, 2020; Messick, 1979) that can have dramatic influences on how well or poorly students learn mathematical concepts and principles. “If educators want to find ways to provide students with the experiences and opportunities with mathematics that empower them and open doors for future engagement with mathematics, understanding students’ mathematics identity development is essential” (Cribbs et al., 2015, p. 1060).
Identity Theory (IT), Social Identity Theory (SIT) and more specifically role identity (role as a student) influenced by stereotype effect (self-assessment as a mathematician) are used as a guiding framework (Burke & Stets, 2022; Schoenfeld, 2022). It is posited that the learning environment and engagement opportunities (or lack thereof), contribute significantly to the development of mathematical identity. Empirical research on mathematical affect in middle grades is sparse and empirical research relevant to mathematical identity is even more rare and recent than mathematical affect, with Butler (2024) and Starr and Simpkins (2021) studies being most notable. Starr and Simpkins, as an example, suggested that mathematics identity stabilized at or around grades nine and ten. They do illustrate that much more empirical work appears to have been invested in science identity thaninmathematics identity. Butler’s study pertained tomiddle-grade identity, but did not ascertain a date by which it stabilized,per se. Instead, his work focused on comparisons by gender and race. Heyd-Metzayunimet al. (2016) state that mathematical identity is poorly defined, which may lead to challenges in empirical research, and it is often researched using qualitative approaches (which may create difficulties with generalization).
Overall,the initial evidence from this descriptive study is conclusive and indicates that mathematical identity and affect are noteworthy variables contributing to a downward trend in student perception of their own identities amongthe predominantly Hispanic, southwestern middle school sample considered in this investigation. The authors acknowledge that in terms of mathematics performance,there is a gender gap between males and females(Mullis et al., 2016). Di Tommaso et al. (2024) state, “International learning assessments nonetheless indicate that girls still lag behind boys in mathematics in most countries” (p. 2). However, is there a comparable gender gap when considering affective and identity variables? Bergin (2016) argues that educators should be interested in understanding the factors that influence interest inScience, Technology, Engineering,and Mathematics (STEM) topics among women and minorities. From consideration of this study’s evidence, lingering questions regarding gender and grade-level attributions arose,suggesting data disaggregation by gender and grade level was necessary to respond to the following research questions:
1.Is there a significant correspondence that may indicate changes in the mathematical identity gap by gender (role identity) between middle grade students?
2.Are there mathematical identity patterns across middle grade-levels for male and female student responses?
3.Are there common themes in students' narrative responses, regarding their mathematical identities, that inform implications for teacher education?
To facilitate and provide focus on the analysis, qualitative and quantitative data were derived from a cross-analysis of demographic data and from the responses to the following open-ended questions included in a questionnaire:
1. Would you consider yourself a mathematician?
2. Why or why not?
In the next section, literature is provided to make the case for the study and to apprise readers of what is known in the field of mathematical affect and identity.
Literature Review
Earlier, mathematical affect and identity were briefly described. In this section, the conceptions of the two psychological constructs are expanded upon so that they are not amorphous. The literature review section first entails a discussion of mathematical affect and then mathematical identity.
It is important to note that mathematical affect and mathematical identity are psychological constructs. A psychological construct is a term that represents something that is either natural, social, practical, or complex.It is for this reason that operational definitions for each construct were provided earlier. These operational definitions were developed using several decades of studies in the literature.
Given their fuzziness(Fried, 2017; Pepin & Roesken-Winter, 2015), psychological constructs are challenging, though important, to define with any degree of accuracy and thus difficult to quantify and perhaps suffer from multiple conceptions. Campbell et al. (2017) refer to psychological constructs as imprecise.
Mathematical affect
In the world of mathematical psychology, affect is comprised of feelings, emotions, beliefs, attitudes, and dispositions (Chiu et al., 2022; DeBellis & Goldin, 2006; Scherer, 2021). Frequently discussed and studied areas of affect in mathematics entail subconstructs such as anxiety (1007), attitude (3167), interest (2155), self-efficacy (464), and value (4461). The numbers listed with the respective subconstructs correspond to the number of publications in refereed journals since 1990, using APAPsycInfoas the search engine. Many of these studies in the past 34 years have been conducted with a comparison on gender, the influence of the affective constructs on performance, and/or may have included more than one construct in the same study. Meta-analyses have been conducted on virtually all the subconstructs.
Very little instrumentation to quantify affective states exists. Likely, the most frequently used instrument in assessing affective subconstructs is the Fennema-Sherman Mathematics Attitude Scale (Fennema & Sherman, 1976). This instrument has been modified and re-normed multiple times but is outdated. More recent instruments are the Attitude Toward Mathematics Inventory (Tapia & Marsh, 2004) and theet al.’s(2017) instrument (Chamberlin Affective Instrument for Mathematical Problem Solving). The latter of the two instruments is believed to be the instrument with the mosteffective subconstructs measured (self-efficacy, self-esteem, anxiety, attitude, value, interest, and aspiration), is the most recently normed instrument with regular use, and was specifically normed after problem-solvingepisodes.
One common overtone that has been realized by policy-makers in many countries is that inordinately negativeor positiveaffective ratings generally will have a deleterious effect on student learning (Chiu et al., 2022; DeBellis & Goldin, 2006). It is therefore not surprising that researchers who implement international assessments, such as the Program of International Student Assessment (PISA),have invested considerable time in investigating students’ feelings, emotions, and dispositions and referred to it as a critical component in student academic success. They did report that students who took the PISA assessment (for 2018 results) stated being happy overall and that positive affect was associated with resiliency in students. For 2022 PISA results, students reported putting forth somewhat less effort. The effects of COVID and remote learning during the four-year period were not necessarily measured and reflected in the data from theOrganisationfor Economic Co-operation and Development(OECD, 2023).
Another common theme in research is that when affective ratings align at a sufficiently high level, the proclivity for learners to realize high levels of learning and achievement may be maximized. As an example, two meta-analyses worth mentioning were conducted by Ma (1997) and Ma and Kishor (1999). In each of their meta-analyses, they ascertained that (a) negative mathematics anxiety resulted in poor mathematical performance and secondarily that (b) attitude did have a statistically significant effect on mathematical achievement, albeit a modest one. It is also known that interest in mathematics diminishes as students age and progress in the educational system (Mann, 2009). As an aside, students’ interest in science also follows a similar trend. Archer et al. (2010) argue that “…the majority of young children have positive attitudes to science at age 10 but that this interest then declines sharply and by age 14…” (p.1).
What is of interest in this study is the age at which mathematical affect stabilizes and becomes somewhat permanent, though not unalterable, as such information can be invaluable to teachers in making curricular and instructional decisions. It is important to note that affective ratings are always situated on a continuum from extremely temporary to extremely stable. Early experiences with anything, whether it is a novel food, a new job, an encounter with a new acquaintance, or an educational domain such as mathematics, result in rather visceral reactions, thus creating affective sentiments that can be captured as ratings. Increasingly extended time with any stimulus, such as mathematical problem-solving tasks, generally results in solidified or sustained/stable affective ratings. Deep affective ratings have been referred to as permanent (Bergin,2016), but that title is somewhat of a misnomer in that affective ratings can be changed; it is simply the case that once they reach a stage of being stable or sustained, they are very difficult to alter. While affective ratings are still in their infancy, they are considered temporary and somewhat malleable (Bergin,2016). Some scholars have postulated that affective ratings seem to stabilize around grade six (Hart & Walker, 1993). Unfortunately, until recently, little empirical data existed regarding when the effect did stabilize. Most insight into the stabilization of mathematical affect was mere theory. Data from one study, conducted by the National Center for Education Statistics(NCES,2003) (2003), suggested that 81% of grade four students reported positive attitudes towards mathematics, but four years later, that number had dropped to 35%.
MathematicalIdentity
It has been established that mathematical affect is comprised of feelings, emotions, beliefs, attitudes, and dispositions (Beltrán-Pellicer & Godino, 2020; Scherer,2021), but some confusion exists among (mathematics) educators regarding what mathematical identity is and how it differs from mathematical affect. According to Wade-Jaimes (personal communication on 2 March 2023), identity differs from affect in that: (a) mathematical identity may be more sociological than psychological, whereas affect may have its roots in psychology, more than sociology; (b) identity may be more influenced by performance (though affect can as well) than emotions, but in specific identity pertains to others’ perceptions of us (extrinsic), while affect may be a bit more internally-driven than by others’ perceptions of us; (c) competence may play a considerable role in formulating identity, while it may well play a less significant role in affect; (d) contrary to affect, in identity the continuum of very temporary to very stable is perhaps a bit less apparent and its equivalent would be core versusfluid.
It may be postulated that the research basis for mathematical identity is slightly less developed than the corpus of research is for mathematical affect. Mathematical affect traces its formal roots to at least the early to mid-1960s (School Mathematics Study Group Records, n.d.) when the School Mathematics Study Group convened the National Longitudinal Study of MathematicsAchievement.
Few patterns seem to have emerged from research on mathematical identity. Cobb and Hodge (201) identified three types of mathematical identity: (1) normative identity (doers of mathematics); (2) core identity (who they are and want to become); and (3) personal identity (impact of classroom variable on identity). One common theme pertains to gender (Bedyńskaet al., 2018; Gentile, 2008; Hawkinson, 2023; Walls, 2010) and its influence onthe development ofmathematical identity. Mathematical identity and mathematics achievement are alsohighly researched focuses(Bibs, 2019; Bonitto, 2021; Hawkinson, 2023). Also,teachersmathematical identity is a commonly recurring theme in research (e.g., Flint et al., 2019; Norman, 2021; Pavlovich, 2020), though the focus is multifaceted in teacher mathematical identity. A lesser researched area is race/culture and mathematical identity (Ayisi, 2022; McGee, 2010; Nasir, 2002).
One commonality in much of the research on mathematical identity is that themajority of research appears in dissertations, rather than in academic journals, as evident in the citations used.Additionally, culture and race are important focal pointsin mathematical identity. Another commonality is that, although mathematical identity and gender are commonly researched foci, scant attention has been invested in mathematical identity and gender at the middle-gradelevel. As an aside, in this respect, the current contribution of mathematical identity and affect can help complete the picture of what is known about mathematical identity and various factors.
The U.S.–Mexico border, particularly the regionunder study, provides a rich and complex context for mathematics learning,shaped by culture, language, and identity. Residents routinely cross not just geographic boundaries but also political, economic, and cultural ones. The proximity of two cities—forming a binational metroplex of two million—creates a community marked by code-switching, strong social ties, and what Tarin et al. (2020) describe as “conflicting dualistic tensions” (p. 53), such as U.S./Mexico and English/Spanish.
Despite the area's cultural wealth, little research has explored how culture shapes K–12 math learning in borderland settings. Some studies, however, focus on local STEM education. Teachers often use Borderland Pedagogy (Cline &Necochea, 2006), which integrates national standards with students’ bilingual, bicultural experiences. Yet challenges persist—students navigate dual languages and mixed instructional traditions. Gallardo (2015), for example, found that teachers moving from Mexico to U.S. classrooms struggled to plan culturally responsive, accessible math lessons. Other research highlights the role of cultural capital. Monarrez et al. (2019) found that local STEM teachers drew on aspirational and familial capital, expressing a strong commitment to student success and community uplift. Similarly, Rincón and Rodriguez (2020) showed that Latino/a STEM students leveraged multiple forms of cultural capital to thrive academically and strengthen their sense of belonging. Together, these studies emphasize the importance of family practices and cultural identity in early math learning. They also point to both the assets and challenges present in borderland education—underscoring the need for flexible, inclusive approaches to math instruction.
Methodology
Research Design
In an educational context, identity is an inclination formed by students to navigate through academic content, settings, and interactions (Bass &Mosvold, 2019). A researcher-developed questionnaire using open-ended questions and metaphors was utilized to explore affective disposition reflective of identity as a mathematician. Specific to this analysis, individual participant responses to the question “Do you consider yourself a mathematician?” provided quantitative frequency data. Additionally, thematic coding of linked individual participant narrative responses to the clarifying question, “Why or Why Not?” provided a qualitative observational window into middle school (grades six, seven,andeight) mathematics students’ identity/perceptions of themselves as ‘mathematicians’ and their positioning toward mathematics. Defining characteristics of affect and identity domains, although overlapping and impacting affect and identity in totality, was the first step to developing coding structures (Table 2). Open-coding of self-reported and observed data, including frequency and meaning-coding, was performed using the coding structure, allowing for the identification of themes or nodes withNVivo software. Multiple ratings and coding were done for each data set toensureinter-rater reliability and consensus.
Aithal and Aithal (2020) argue that the purpose of an unstructured questionnaire is to collect qualitative information using mostly open-ended questions. The research design approachenabled the collection of a large amount of data that could be generalized and a conceptualization of reality through a dialogical approach to data collection,encompassing the context and meaning of participant responses (Bakhtin, 2010; Marshall & Rossman, 2006). The researcher-developed questionnaire provided data to measure self-reported identity as a characteristic of affective disposition. The questionnaire consisted of three sections: demographic information, open-ended questions, and metaphor prompts (Appendix A).
Questionnaire
The researcher-developed questionnaire had two versions: one forteachers and a second forstudents. Each questionnaire consisted of three sections: demographic information, open-ended questions, and metaphor prompts. Aspart of a prior study, the draft questionnaire was administered to and reviewed voluntarily by fifteen middle school (grades 6-8) mathematics instructional coaches. Their feedback on the design and format of the questionnaire was incorporated intoinstrument revisions. As applicable to this exploration, the questionnaire was redesigned to reflect unique prompts and questions identified as pertinent to teacher and student participant classifications. An additional review step was taken by administering the questionnaire to thirty-three participants selected based on their membership in an undergraduate, elementary mathematics methods course offered at a university located in a border region (Lynch-Arroyo, 2013).
Metaphorical response examples are provided only as supporting data,not for triangulation of data. Identifying and coding of thematic characteristics (Table 2) provided a qualitative measure linking to and supporting quantitative data. Future studies will undertakean analysis of studentsmetaphorical responses. For purposes of these analyses, the foci were student demographic information and open-ended questions. The questionnaire provided data to measure students’ self-reported affective disposition and identity toward mathematics (i.e., conscious and unconscious positioning).
Setting and Participants
As part of a larger studyinvolving teachers and students, the sample comprised students enrolled in a large urban school district (with over 50,000 total enrolled students) and were in middle grades, located in a border region betweenthe United States and Mexico. Of the 4,000 questionnaires distributed by all middle school mathematics teachers in the district to all their students, 1,526 student questionnaires were voluntarily returned for a response rate of 38.15%. Seventy-eight of the 1526 questionnaires were excluded from the data set due to incomplete responses, leaving a sample (N) equal to 1,448 questionnaires. Just as with homework submission (an entirely different area of research), some students did not return questionnaires, or parents/guardians did not give voluntary consent. Student questionnaires returned were a representative sample of all teachers’ classes included in the study (Questionnaire forms were coded with a teacher number; anonymity of students was maintained).
Through analysis of demographic questions included on the questionnaire, it was possible to determine and describe the characteristics of the participants individually and as a group. Demographic descriptors were used to facilitatetheidentification of themes and groupings of participants based on responses. The sample, in terms of demographic and environmental criteria, was representative of the district student population andthe border geographical area (although the researcher does not assume generalizability of theresults to the population), as represented in Table 1, Student Self-Reported Demographics.
Table 1. Student Self-Reported Demographics
| 1 | Gender | |
| Male | 51% | |
| Female | 49% | |
| 2 | Ethnicity | |
| White | 20% | |
| Hispanic | 63% | |
| African American | 8% | |
| Asian | 4% | |
| Other | 5% | |
| 3 | Grade(s) | |
| 6 | 35% | |
| 7 | 36% | |
| 8 | 29% | |
| 4 | Languages Spoken | |
| English | 38% | |
| English/Spanish | 53% | |
| English/Other | 9% |
The sample was nearly an even distribution between male and female students, as well as reasonably distributed among the grade levels. As aHispanic-dominatedgeographic region, it was expected that most students would identify as Hispanic and as bilingual, English/Spanish speakers. [Note: Questionnaires were provided in English and Spanish.]
Data Collection
Sources for this data set consisted of demographic information and open-ended questions from the questionnaire. The use of a researcher-developed questionnaireenabled the conceptualization of reality through the combination of closed and open-ended questions, allowing for the collection of both frequency and qualitative data that encompassedthe context and meaning of participant responses. As described in the results section, data collection, coding, and analysis built a scaffold conducive to valid data interpretation,leading to key conclusions reflective of the suggested mathematical identity of the participants.
From each student’s collated questionnaire responses, a frequency counting of ‘yes/no’ responses to the question “Do you consider yourself a mathematician?” was performed and disaggregated by gender and grade level. Using NVivo software (Qualitative Solutions ResearchInternational, 2006) for qualitative analysis, narrative responses were entered verbatim for each student,identifying the most frequently used descriptor terms and expressions. Examples of anecdotal responses included: “No, I’m not the smartest in math,but I’m not the worst either.” “No, because I am not really good at math. I have a lot of trouble.” “Yes, because math is my favorite and highest-grade level class (sic). Math comes to meeasily.” “Yes, because I know everything I learned.” (Descriptor Themes: Self-concept/Identity and Attitude).
Using simile as an instantiation of metaphor, the open-ended prompt “Mathematics is like… Explain Why” responses were used as supporting data. Using NVivo software for qualitative analysis, narrative responses were entered verbatim for each student,identifying the most frequently used descriptor terms and expressions. Examples of anecdotal responses included: Mathematics is like “Cement shoes dragging down my heart: I’m not smart like my friends. All I like is drawing and making food. Math – I barely like it. Too much work and it gives me headaches like bullets going through my head.” Mathematics is like “A thorn in my side: because I don’t get some of it and I forget how to do something.” Mathematics is like “Sunshine: it is beautiful and warming.” Mathematics is like “My 2nd best class: because it’s the class I actually understand.” (Descriptor Themes: Self-concept/Identity and Attitude).
Analysis of Data
Affirming the importance of student identity and affective disposition, Bishop (2012) states, “(…) the National Research Council (NRC) recognized affective components of learning mathematics,saying, ‘[s]tudents’ disposition toward mathematics is a major factor in determining their educational success” (p. 35). The collection, analysis, and synthesis of the data required an integrated approach reflective of the authentic responses/storylines of the participants.
The focus for frequency data analysis was on the distribution of ‘yes/no’ responses representing student identification/nonidentification as a mathematician (identity as a characteristic of affective disposition). The following nonparametric statistics and approaches were used fortheanalysis of frequency data in response to research questions:
Chi Square (p< .01; Cramer’s V .061): ‘Between male and female responses, is there a significant correspondence that may indicate a narrowing or widening of the mathematical identity gap between middle grade students?’ Z-Score (two-tailed;p< .01) and Distribution Analysis: ‘What are the mathematical identity patterns across middlegrade levels for male and female student responses, and is there a significant trend that may indicate a narrowing or widening of themathematical gender identity gap?’ Discourse Analysis: ‘What were the commonalities and themes in narrative responses?’
Linguistic deconstruction, meaning making, and discourse analysis (Kvale & Brinkmann, 2009) were the main tools of coding and analysis of the qualitative data gleaned from student responses to the open-ended question of ‘why’,clarifying their response of ‘yes or no’, as well as responses to the prompt “Mathematics is like…Explain why”. Each episode of the storyline identified the most frequently used descriptor terms and expressions and was deconstructed using linguistic analysis and meaning coding (Kvale & Brinkmann, 2009), recognizing internal and external cues in storylines. The focus of qualitative data analysis was on the meaning coding of the characteristics of identity/affective self-reported disposition using focused operational,defined descriptors presented in Table 2 and as illustrated in Table 3.
Table 2. StudentMathematics Identity/Affective Disposition Descriptors
| No | Descriptors | Positive Identity | Negative Identity |
| 1 | Usefulness, sensibleness | Engages in learning opportunitiesSense making and understanding Grades as a positive indicatorApplies mathematics to real-world applications and is challenged by content | Limited engagement in learning opportunities Sees mathematics as difficult Possesses weak content knowledge Grades as a negative indicatorDoes not see contextual relevance |
| 2 | Self-concept/ Identity | Identifies as a mathematician,Sees themselves as mathematically smartFacilitates and shares knowledge, Likes collaboration, Possesses strong content knowledgeBecomes a resource for other studentsIs interested in and inspired by mathematics | Does not identify as a mathematicianDoes not see themselves as mathematically smartRegurgitates information, Avoids collaboration, Relies on peers to be a resource,Believes mathematics ability is innate (‘I’m not a math person’) |
| 3 | Attitude | Accepts constructive and effective criticism Accepts challengeEnthusiasticIdentifies as good at mathematicsHas a growth mindset | Resents constructive and effective criticismAvoids challengeNon-enthusiasticIdentifies as not good at mathematicsHas fixed mindset |
As described in Table 2 above, thematic coding was considered not as a precursor to analysis, but as a unit of analysis and the “best representation of (…) thinking about the phenomenon at a particular time” (Weston et al., 2001, p. 391). Identity and affective disposition are generally fluid and, as such, are analyzed using descriptors identified in the data at a single moment in time (i.e., data is not longitudinal). Fluidity of identity and affective disposition is represented in the identity continuum (Table 3).
Table 3. Mathematics identity continuum: Sample student responses to metaphor prompts
| No | Positive Identity | Negative Identity | |
| 1 | If mathematics were an animal, it would be… Smart dog: because we would learn very fast and be smart. | If mathematics were an animal, it would be… A cheetah: It goes fast. | If mathematics were an animal, it would be… A lion: because it’s dangerous. |
| 2 | If mathematics were a plant, it would be… Roses: because it’s red, relaxing and distracts you. | If mathematics were a plant, it would be… A fruit tree: because it gives us a lot to learn in a year. | If mathematics were a plant, it would be… A cactus: because it would be spiky!! |
| 3 | If mathematics were the weather, it would be… A day at a beach because it is cool | If mathematics were the weather, it would be… Partly cloudy: because it is good to learn but hard in some parts. | If mathematics were the weather, it would be… A stormy day: because the first picture that pops into my head when I say or hear the word mathematics is thunder, lightning, and a lot of rain. |
Meaning coding and frequency of response/observation measurements were utilized to identify themes of identity/affective disposition reflective of mathematical identity. Consistency in definitions was present throughout the study when identifying and coding students’ supporting data.
Results
Quantitative data were collated and analyzed using Chi-square and Z-scores. These data were also collected and analyzed using discourse analysis of open-ended, narrative responses. In total, over 1,500middle-gradestudents from the U.S.-Mexico border region responded to the questions (711 males, 49.1% and 737 females, 50.9%). With annof 1,526 out of 4,000 returned (38.15%), the non-response bias was a concern. Forty percent of participants, aggregated by gender (but disaggregated data is shared in the results section), said that they would consider themselves mathematicians. Males considered themselves mathematicians at a statistically significant difference (.01 level)fromfemales. Data supported Else-Questet al.’s (2010, p. 103) claim that “stereotypes that girls and women lack mathematical ability persist, despite mounting evidence of gender similarities in math achievement”.
To respond to the first research question, ‘Is there a significant correspondence that may indicate changes in the mathematical identity gap by gender (role identity) betweenmiddle-gradestudents? ’. Chi-square tests focused on a relationship between two categorical variables (males and females). The analysis indicated that there was a significant relationship between males and females in their response to the question, “Would you consider yourself amathematician?”. Pearson Chi-Square results and analysis (Table 4)indicatea narrowing of the gender gap in terms of male/female mathematical identity.
Table 4. PearsonChi-SquareAnalysis
| No | Gender | Yes | No | Pearson Chi Square | p-value | Significant | Cramer’s V | Approx. Significant |
| 1 | Male | 312 | 399 | 8.8343 | 0.002956* | Yes | ||
| 2 | Female | 267 | 470 | 8.8343 | 0.002956* | Yes | ||
| .061 | .675 |
Significance level:p< .01*
Regarding the second research question, ‘Are there mathematical identity patterns across middle grade-levels for male and female student responses?’ Z-score tests for differences between two categorical variables (males and females) by grade levels were used. Analysis indicated that there was not a significant difference between males and females in their response to the question, “Would you consider yourself a mathematician?” Analysis indicated that a narrowing of the gender gap in terms of male/female mathematical identity was not significant (Table 5).
Table 5. Z-Score Analysis
| No | Grade | Male | Female | Z-Score | p-value | Significant |
| 1 | 6th grade - Yes | 124 | 121 | 1.1811 | 0.238 | No |
| 2 | 6th grade - No | 117 | 141 | - 1.1811 | 0.238 | No |
| 3 | 7th grade - Yes | 100 | 85 | 2.0576 | 0.394 | No |
| 4 | 7th grade - No | 150 | 186 | - 2.0576 | 0.394 | No |
| 5 | 8th grade - Yes | 88 | 61 | 2.1761 | 0.2926 | No |
| 6 | 8th grade - No | 132 | 143 | - 2.1761 | 0.2926 | No |
Percentage distribution analysis (based on frequency counts) was used to further identify mathematical patterns. As shown in Figure 1 below, students’ identities appear to gravitate downward around grade seven and students, generally, do not perceive themselves as mathematicians.
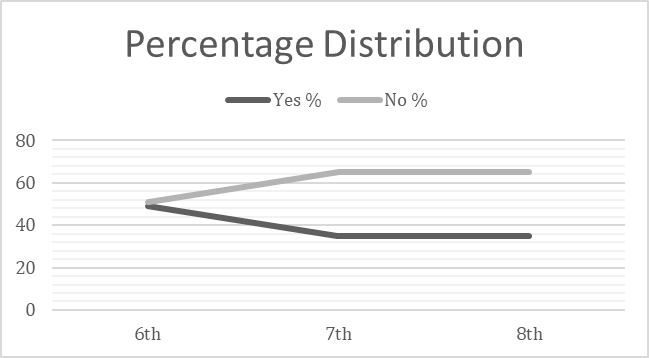
Figure 1. Percentage Distribution/Pattern of mathematical identity across grade levels
Further substantiation of the percentage distribution trend was accomplished by using linguistic deconstruction, meaning making, and discourse analysis (NVivo), narrative responses were deconstructed, and frequencies of terms identified to answer the third research question “ Are there common themes in students' narrative responses, regarding their mathematical identities, that inform implications for teacher education?” In narrative responses to “Would you consider yourself a mathematician?” of all the responses of “Yes” for males and females, 75% of those responses included statements such as “being good at math”, “getting good grades”, “knowing”, “being smart”,and “not hard”. An anecdotal narrative sample response supports the analysis: “Yes, because math is my favorite andhighest-grade level class (sic). Math comes to me easily.” (Descriptor Themes: Self-concept/Identity and Attitude).
Negative student responses to the posed question, “Would you consider yourself a mathematician?”, are, likewise, predominately focused on “not being good”, nor having “good grades” in mathematics. Of all the responses of “No” for males and females, 65% of those responses included statements such as “being good at math”, “getting good grades”, “knowing”, “being smart” and “not hard”. An anecdotal narrative sample response supports the analysis: “No, because I am not really good at math. I have a lot of trouble.” (Descriptor Themes: Self-concept/Identity and Attitude).
Implications of each of the key findings will be addressed in the following discussion section with emphasis on mathematical affect, mathematical identity, male/female gap implications, and middle grade stabilization.
Discussion
The key findings in this study indicate that students’ mathematical identity/affect appear grounded around grade seven,and students generally do not perceive themselves as mathematicians. Additionally, male/female differences are not significant,as supported in discourse analysis. This finding is consistent with Butler's (2024) results. Within the context of this study,the discussion of results is situated within the defining parameters of the concepts of mathematical affect, Identity Theory, mathematical identity, thegender (male/female) gap implications (role identity), and grade-level stabilization.
Mathematical Affect
Recognition of self-reported affective disposition is a critical element in understanding the complexity of student affective disposition toward mathematics and the implications for the mathematics teacher at the middle grades,in order to support mathematics learning. If the intent is to arrive at a better understanding of howmiddle-gradestudents learn mathematics, understanding students’ affective disposition toward mathematics, mathematics teaching, and mathematics learning (positive or negative) in the context of influencing internal variables is key to connecting mathematics learning and mathematical identity. For instance, in this study the majority (65%) of the students who responded negatively to the question ‘Would you consider yourself a mathematician?’ seem to have developed a negative mathematical affect when they believe they are "not good at math," and “not receiving good grades,” which can lead to a decreased motivation to engage with mathematical learning.
Ingram (2015) theorizes that when examining affect, there is a connection between affect (internal variable) and mathematics learning. Ingram further suggests,“The students negotiate the meanings constructed from their interpretations of their learning experiences and these meanings either reinforce or alter the elements of their relationship with mathematics” (p.304). In the terminology of this paper, these negotiations between mathematics and the learning context are referred to as a storyline influencing mathematical affect.
Kilpatrick et al. (2001) identified positive mathematical affect as one of five strands for mathematical proficiency. They defined this construct as “(…) the tendency to see sense in mathematics, to perceive it as both useful and worthwhile, to believe that steady effort in learning mathematics pays off, and to see oneself as an effective learner and doer of mathematics” (p. 131). From the discourse analysis of students’ responses to the clarifying question of why or why not they considered themselves mathematicians and in the later simile prompt, ‘Mathematics is like…’, the predominance of the construct of being proficient or not proficient at mathematics, as well as making good grades,was reflective of how students see themselves as mathematics learners. The anecdotal example from this study supports Kilpatrick etal.'s(2001) statement of seeing oneself as an effective learner and doer of mathematics: “If mathematics were an animal, it would be… Smart dog: because we would learn very fast and be smart” or the storyline of being good at mathematics and making good grades makes one a mathematician. (Descriptor Themes: Useful/Sensibleness).
Recognizing learning as a social process requires identification of affective variables,affording the necessity of consideration of the “who” and “why,” in addition to the “what” and “how” of the instructional process. Without the inclusion of the “who” and “why”, navigation in complex educational settings is limited. To facilitate identification of the “who”, isolating and analyzing the construct of identity was paramount in this study. Although, as Ingram (2015) stated,there has been some research making connections between mathematical affect and identity. Further investigation of the impact of learning as a social process (storyline) contributing to the development of mathematical identity is needed.
Identity Theory
Discussed in the introduction, Identity Theory (IT) provided a framework to explore whethermiddle-gradestudents identify themselves as mathematicians or not. Specifically for this research, Social Identity Theory (SIT) andits further delineation, specifically role identity, served asthe guiding points of reference. Specifically, the frequency data ofmiddle-grade students'self-assessment as a mathematician or not as a mathematician (stereotype effect) was collected and analyzed as related to role identity.
Engaging in mathematics and performing well is impacted by a student’s identity (see themselves as a mathematician) and their belief that they can effectively learn (succeed and/or fail). Oslund and Barton (2017) assert, “It is difficult but important for mathematics teachers to help students see themselves as capable mathematics learners, that is, to help each student develop a positive mathematics identity” (pp. 21-22). It is just as important to be aware that identity can evolve and change. Identity development, includingmathematicalidentity, can be a process that occurs over a lifetime. It has been widely documented in the field of developmental psychology thatthemiddle school years are a periodduring which identities are generally formed. Storylines leading to identity formation may be conflictive and dependent on the environment or group positioning occurring during this period of adolescent development (Allen & Schnell, 2016). In reference to this research,anadditional longitudinal study is needed to support these findings.
Mathematical Identity
If one defines mathematical identity as a storyline, then it follows thatmathematicalidentity is developed in reaction to the instructional factors and social interactions surrounding and challenging students on a daily basis. How students react to events, interact with the teacher and peers, assimilate public perceptions of mathematics (social media, advertising, and parental influences),all contribute to forming mathematical identity at a moment in time.
“Within the mathematics domain, identity has been particularly critical, because mathematics identity has been linked to whether students persist and ultimately pursue challenging mathematics activities or coursework” (Miller-Cotto & Lewis, 2020, p.2). Based on the cross-sectional data of this study, there is a clear negative identity pattern that appears to be stabilizing in the seventh grade. Further longitudinal research is needed to substantiate this assumption.
Little is knownabout how to support the development of positive mathematical identities for middle-gradestudents (Hall, 2016). In a study ofeighth-gradestudents, Usher (2009) identified four “pillars” of practice to support mathematics identity: (a) Knowing and believing in your students; (b) Redefining mathematical success; (c) Prioritizing student voice; and (d) Monitoring identity formation. Of these four pillars, redefining mathematical success in terms of mindset may require a re-culturing of the school environment and a major shift in mathematics instruction (particularly the emphasis on grades and testing). If students only see mathematics as a set of rote rules, algorithms, and procedures to be learned and followed without meaning, they will likely form fixed mindsets and see themselves as “bad” at mathematics (Boaler, 2022; Dweck, 2006).
Gender Gap Implications
The impact of genderon success in mathematics has been extensively researchedin recent years. In fact, the 2022 PISA results indicated that, in terms of mathematics performance, the gender gap between 2018 and 2022 remained largely unchangedin most countries; males continued to outperform females (OECD, 2023). However, scores did drop in 2022 for both male and female students. Recognition of gender as a social variable influencing the development of mathematics affect and identity is now accepted, as well as contributing to educational and occupational opportunities. Mathematical male/female stereotypes have been influenced by the external socio-cultural environments influencing educational settings, including access to education, role models, and the formation of teacher mathematics affect and identity. Di Tommaso, et al. (2024) found that “Such forces can erode girls' sense of self-confidence and self-efficacy and increase their anxiety about doing math” (p.2). This claim has been substantiated by myriad researchers (e.g.,Ho et al., 2000;Niederle& Vesterlund, 2010; Zander et al., 2020) However, in recent years, there has been a concerted effort to address the gender gap in STEM with the creation of all female STEM academies, recognition of successful women in mathematics, and recruitment efforts aimed specifically to attract females to STEM education and occupations. Stereotype threat, as an extraneous variable contributing to the development of identity, was not readily apparent in this particular study. Nevertheless,Burke and Stets(2022) found “Students experiencing stereotype threat perceive that society views them as incapable of competent academic performance, leading to anxiety and ultimately worse scores on exams and assignments” (p.427), which supports the need for additional identification and research in socio-mathematical identity.
Findings from this study align with other study findings, which show that there are no significant male/female differences in how students in grade seven identify with mathematics, and that is how they see themselves in relationto mathematics. When studying sixth and seventh grade students, Cleary and Chen (2009) found, “A significant gender effect, albeit small, but there was no interaction between grade and gender” (p. 307). Further, Ghasemi and Burley (2019) reported that gender differences in interest and confidence in mathematics, and the value of this subject are quite negligible. Ghasemi and Burley (2019) suggest that males and females are similar when it comes to liking or valuing mathematics and how students see themselves.
It is the contention based on the results of this study that there isa narrowing of the male/female gap in middle grade students’affect and mathematics identity. There was an indication that an identity gap between males and females seems to be narrowing and extraneous variables, such as stereotype threat, seem to have little or no bearing on mathematical identity formation at middle grades. However, additional research and data are needed to support this contention and in no way implies generalization at this time.
Grade Level Stabilization
Data reported in this study align with other similar studies focusing on middle grades. (Cleary & Chen, 2009; Ghasemi & Burley, 2019). Cleary and Chen (2009) found seventh graders “… were also less interested in math activities and actually perceived math to be less valuable to their future academic pursuits than the sixth-grade cohort” (p.307). Similarly, Ghasemi and Burley (2019) attributed the descending trend to middle grades asarepresentation of students embarking on higher mathematics studies, as well as the socio-cultural environment in middle grades.
Encouraging is the notion that pedagogical approaches to mathematics content haveshifted to addressissues of inclusion, access, and representation in mathematics (Simic-Muller, 2023).It is likely that moving away from genderstereotyping in STEM education and providing open, alternative opportunities has had a positive impact on narrowingthe gender gap – at least in terms of affect and identity.
Implications of the Results
This study contributed to existing research and substantiated a negative trend in mathematics affect and identityamong middle-grade students, particularly inseventh grade. The implication of this finding is that it becomes imperative to exploremiddle-grade mathematics curriculum, teaching and learning environments, gender and age-specific socio-cultural variables, and their implications for middle-grade mathematics education in order to address the seventh-gradeturning point in student mathematics identity and mathematics affect. Simply stated, grades four, five, and six are imperative in the formulation of mathematical affect and identity (Fergus & Smith, 2022; Field et al., 2019; Hart & Walker, 1993),and there is a need to examine correlations betweenmiddle-gradeteaching and learning environments within the scope of Identity Theory. This finding agrees with the findings of Schoenfeld (2022), “The challenge is to create robust learning environments that support every student in developing not only the knowledge and practices that underlie effective mathematical thinking, but that help them develop the sense of agency to engage in sense making.” (p.2). If students believe or it is implied in the learning environment that they are academically deficient in mathematics, their sense of identity as a mathematician is then impacted.
Dou and Cian (2022) emphasize that “Identity theory postulates that individuals author identities through personal and social negotiations with members of communities who possess a unique collection of characteristics that distinguish them from community outsiders.” (p.3). A reassessment of current socio-cultural-economic variables andtheir impact on the development of mathematics affect and identity, spanning from elementary to middle grade levels,is necessary. That is, identifying the building blocks as variables and ascertaining a correlationbetween them and the resulting effect on middle-grade mathematics is necessary.
Conclusion
It is surmised from this exploratory study thatmiddle-gradestudents’ mathematical identities (non-gender specific) stabilize in approximately grade seven. Whether a positive or negative identity is formed, navigation through the mathematics education environment is generally influenced by perspectives of ‘being good at mathematics,’ ‘getting good grades,’ levels of perceived ‘difficulty or easiness,’ and an innate ‘like or dislike’ of mathematics. An encouraging finding in this study, however, is that girls are starting to close the gap on boys in mathematical affect and identity, using self-ratings.
Hall (2016) posits “…as long as a student’s attitude/behavior towards mathematics is accepted as such (i.e., a negative disposition), then it will remain unchanged” (p.113). Now is the time to be proactive and address Cleary and Chen’s (2009) challenge by making strong efforts to make learning intrinsically interesting or enjoyable for students, whichshould be an important focus of middle school administrators and teachers. These processes have important implications for the choices students make about becoming strategically and cognitively engaged in their learning.
Based on the results of this study and others, middle grades mathematics education needs to be a priority focus,and though it may be trending in a positive direction, work remains to be done. Prior to pursuing or recommending changes in practice, it may be as important first to establish a reciprocal relationship between social, instructional, and developmental variables and mathematical identity formation in specifically seventh grade. One example of an arearequiring further attention is the continued focus ongender. The results of this study indicatedthatmales considered themselves mathematicians at a statistically significant differencefromfemales.Recently,there has been asignificant increase inefforts to encourage female participation in STEM. As evidenced in this study’s data, a narrowing of the gender gap, concerted efforts to address gender, as well as other demographic factors, continue to be anemerging trend area of focus to address (particularly at the middle school level).
Recommendations
Learning Environments
Researchers should investigatethe variables in teaching and learning environments that are critical to fosteringa positive identity and affect. In essence, questioning if the current outcome-based approaches are the most appropriate without necessarily supporting the development of not only social identity, butalsomathematical identity.
Curricular, Pedagogical, and Socio-Cultural Issues
It will be important for future researchers to explore what variables contribute to significant gender-neutral pattern dips in seventh grade. Researchers may be able to explore answers to questions of what curricular, pedagogical, and socio-cultural issues are implicated. For instance, ‘Does a reciprocal relationship exist between variables and mathematical identity formation and in what ways?’, ‘How can the school cultural paradigm (policies and practices) be shifted, andmathematics success be redefined?’, or ‘What effective teaching, instructional, and classroom opportunities can be leveraged to contribute to positive mathematics identities?
Mathematics Teacher Education
The researchers initially hypothesized that learning environments and engagement opportunities (or lack thereof), contribute significantly to the development of mathematical identity. Two examples of learning environmental variables are effective teacher feedback regarding student performance and safe learning environments. AsBurke and Stets(2022) puts it, “Results here indicate that students come to understand their ability as students not only through their performances but also through the reflected appraisals of such performances” (p.437). Based on the perceived downward pattern of negative mathematical identity, it is suggestedthatprofessional development focusing on developing skills for giving effective student feedback may have a significant effect on student mathematical identity development.
Additionally, when creating a safe mathematics learning environment,Boaler(2022) advocates that teachers position themselves as valuing mistakes and struggle as positive elements ofthe learning process. In a historical world of one right solution, memorization, algorithms, and ‘do it my way or the highway’ mathematics teaching approaches, changing the teacher messaging about mistakes and error analysis may require significant mindset shifts through repeated teacher education, professional development, and practice paradigm shifts.
Limitations
Although this study is perceived as a springboard for future research topics, the isolation of demographic data andthe use of singular open-ended questions arehampered byanarrow focus and limited data analysis. The examination of these data did notyield compelling evidence that can be generalized to all middle-grade environments. Additionally, some teachers may have been more successful than others in cultivating positive affective dispositions/identities towards mathematics (teacher data not included in the analysis), potentially limiting theconclusiveness of outcomes. Therefore, additional exploration is needed to substantiate the impact this purported grade seven stabilization may have on mathematics affect, mathematics identity,and variables of mathematics teaching and mathematics learning. It is possible that in future research, utilizing a generative research framework, there will be opportunities where questions generated by this study can be further explored.
An additional limitation of potential researcher bias (prior employment in/knowledge of researched school district) was acknowledged and mitigated by utilizing multiple independent coders (doctoral students).The Delphi Method of Consensus was utilized to ensureinter-rater reliability of coding.
This research did not receive any specific grant from funding agencies in the public, commercial, or not-for-profit sectors.
Ethics Statements
Authors stated that the study was approved by the Institutional Review Board oftheUniversity of Texas at El Paso on October 25, 2012, with reference number: 371173-1.The authorsfurther stated that the article is the authors' own original work, which has not been previously published elsewhere.
Conflict of Interest
No conflict of interest is declared bytheauthors.
Funding
No funding source is reported for this study.
Generative AI Statement
The authors stated that they did not use any generative AI orAI-supported technologies in the preparation of this paper.
Authorship Contribution Statement
Surnames: Lynch-Arroyo, Chamberlin, and Medina-Jerez contributed to: Conceptualization, design, analysis, writing, editing/reviewing, critical revision of manuscript, final approval, and supervision of the manuscript.